![]() Graph
Graph
| Top | Previous | Next |
|
|
|
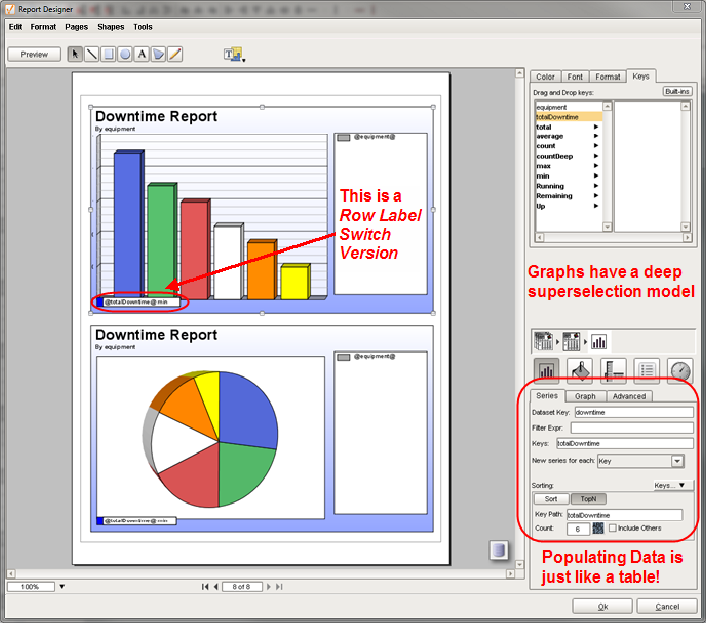
The Graph Populating data including the concepts of data keys, sorting, and filtering are nearly identical to that of a table. The look of the graph has a much deeper superselection model than a table.
We will explore graph options with a total downtime by equipment example. The same data is used as the table example. A downtime summary can be retrieved with the following SQL query: SELECT equipment, sum(time) AS totalDowntime FROM downtime GROUP BY equipment;
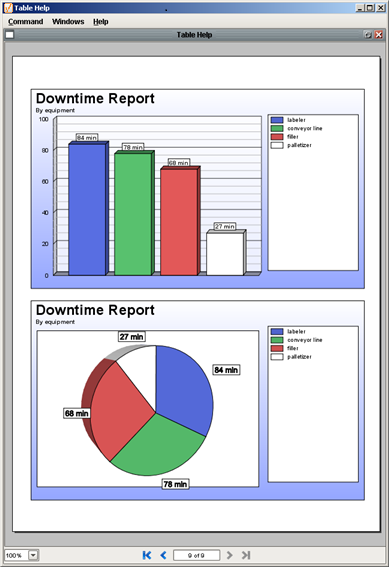
Report in the Ignition runtime
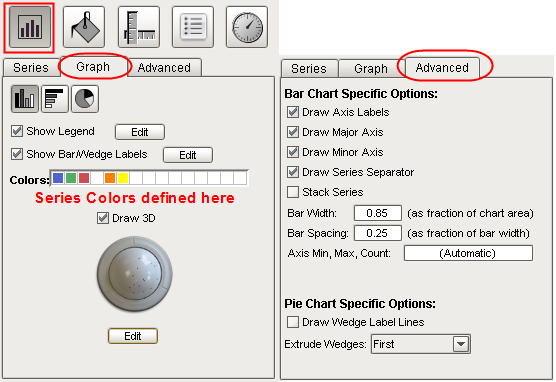
Basic graph settings can be found on the Graph Tab of the graph shape specific inspector.
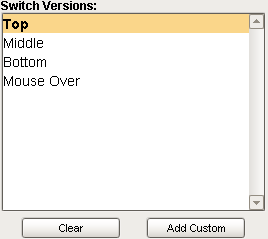
Embedding Graphs in a table row Graphs can be embedded in table rows. Leave the Dataset Key blank to have access to the data provided at that level of grouping! This technique is demonstrated in Tutorial #2. Since a graph is generally a large shape, you usually want to define an explicit page break for the row that contains the graph, so that the graph won't get chopped off on a page boundary. Select the light gray region to the left of the Group in the Table inspector to do this. Row Label Switch Versions are a way to have the graph position labels on each row (Bar in a bar graph, slice in a pie graph). Both examples above use builtin graph labels. The "Top" version label on a bar graph will place the label just above the top of the bar on the Y plane for each line. Middle and bottom work similarly. You can get to the switch versions customizer two ways:
Custom Children The Graph shape supports additional custom children. Add axis labels or arbitrary text by superselecting the graph and using standard tools such as Text, Rect, Polygon, etc. You can reference keys in added text children which will be evaluated against the group of objects provided for the graph.
|