|
The CrossTab  is a DataSet element like the table and graph. It shows a summaries of cross sections of data. To be useful, crosstab data should have the following: is a DataSet element like the table and graph. It shows a summaries of cross sections of data. To be useful, crosstab data should have the following:
| • | Lots of repetitious data. You should be looking for sums, averages, or other aggregate functions |
| • | At least 2 (key) columns whose data are repetitious compared to the number of rows. Your data should look "rectangular". For example, If there is only one row for each combination of values of the 2 keys, you will get a trivial crosstab. |
| • | You will typically have a third column that is a number to perform an operation on. Examples are: summing money, displaying average response times, counting occurrences, etc. |
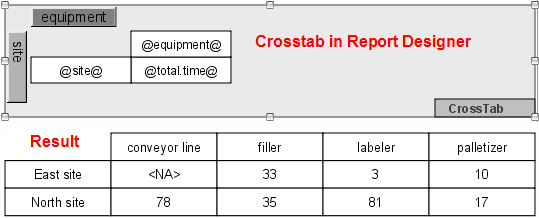
The CrossTab template is much simpler than the table template. By default it just shows one cell of a simple table. This is usually configured with an aggregate key, like "@total.getAmount@". After that, grouping keys are dragged to the horizontal and vertical axis.
Example
We will use a crosstab to illustrate total downtime by equipment and location.
Employee data can be retrieved from the accounting database with the following SQL query:
SELECT * FROM downtime;
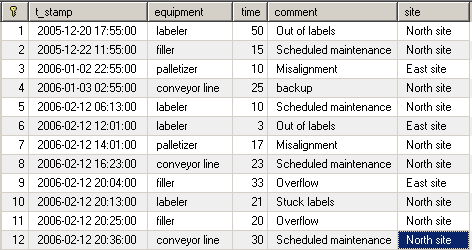
Notice that the example only has 2 unique sites. This is because we only have 12 rows of data.
|