Top  | Previous | Next

header_logo Tables - Basics

Let's go through the process of creating a simple table! We will cover: getting data into the report, creating a table, defining data, and explore basic parts. Make sure you understand how the Dataset key defines the table's DataSet.

example2

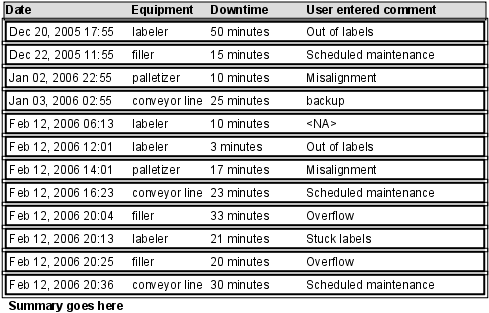
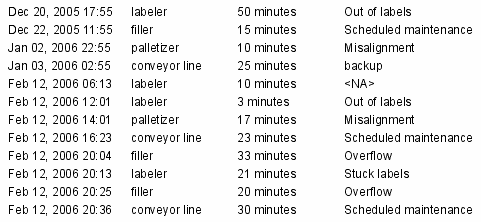
Resulting Basic Table


Getting data into the report

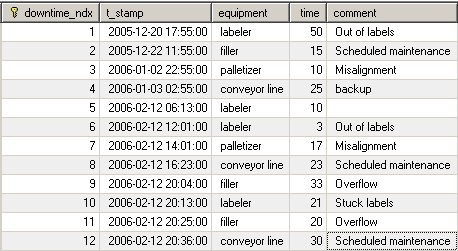
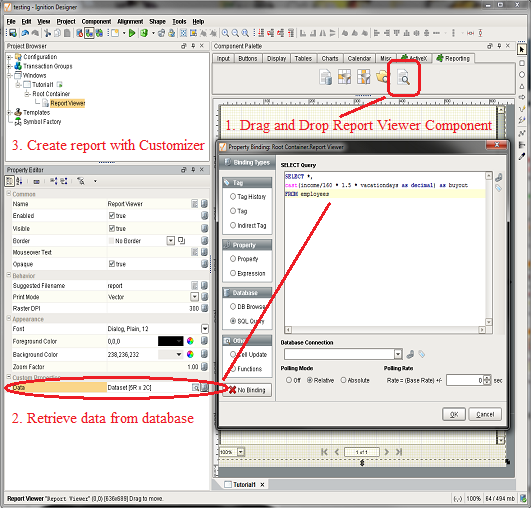
Before creating a useful table, you must get the data from the SQL database into the Report Viewer.

Example downtime data can be retrieved with the following SQL query:

SELECT * FROM downtime;

downtime

Populate the Report Viewer's default dynamic dataset, Data.

tutorial1-2-1s

(Illustration from Tutorial #1).

Your report now has data. You're ready to create a table!


Creating a Table

1.Open the Report Designer by selecting the Report Viewer in the Ignition Designer and applying the customizer (Cntl+U).
2.Click the table icon on the add shapes button of the toolbar.
3.Size and position table as desired.

step1


Defining Data

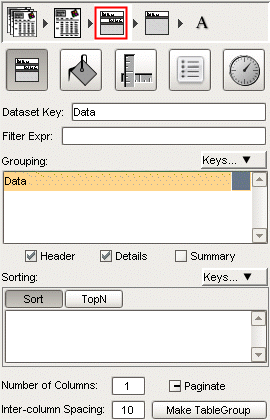
The Dataset Key is the name of the DataSet that a table or graph is getting its input from. @yourSubstitutionKey@ in the table with a defined Dataset key will work as if it were @DataSet_Key.yourSubstitutionKey@

1.Click the table to select it
2.Select the Table Inspector

inspectortable

3.Under Dataset Key:, type Data or drag the Data DataSet from the Keys Attribute Panel, choose table and click ok. This is the step that defines which DataSet this table will use. You may only define one per table. If you created the table by dragging the DataSet, you will not need to fill in the DataSet Key in the next section.

With a defined dataset key, your table can reference that data without explicitly defining the path. For example, in this table, @Data.comment@ is the same as @comment@.

4.Drag Keys to the table columns from the Keys Attribute Panel. We appended the string "minutes" to the time label and formatted the date.

dragdata

5.Click btnpreview to view your table.

examplesimple

6.Click "Header" and "Summary" check boxes in the Table Inspector. Add text labels to Header and Summary.
7.Select Data Header, add a Fill Color (Background) in the Fill & Stroke Inspector.
8.Select Data Details, add a Stroke Color (Outline) in the Fill & Stroke Inspector.
9.Adjust text, fill, and stroke as desired.
10.Click btnpreview to view your table.

example2


Anatomy of a Table

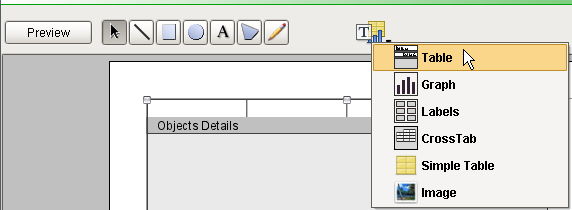
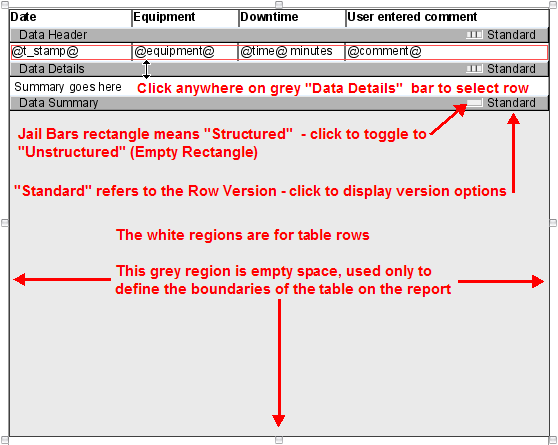
There aren't many parts to a table.

You have the entire table to define the region on the report that the table occupies. Much area of simple tables often end up as a placeholder.
Header, detail, and summary rows are optional for each level of Grouping.
The Table Inspector and Table Row Inspector are where table configuration occur.

tableparts

Previous (Table Overview)   Next (Table Rows)


TIPtip

Tables can also be created by dragging a DataSet to your report. This will automatically set the Dataset Key.