![]() Tutorial 2 - Basic Layout
Tutorial 2 - Basic Layout
| Top | Previous | Next |
|
|
|
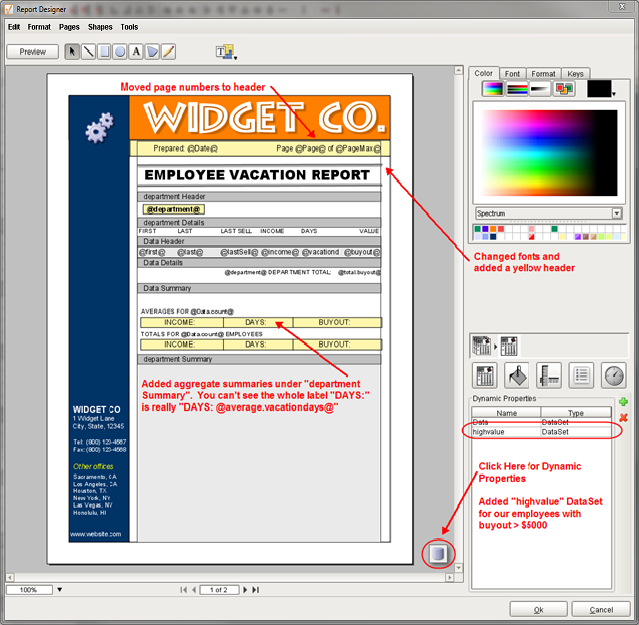
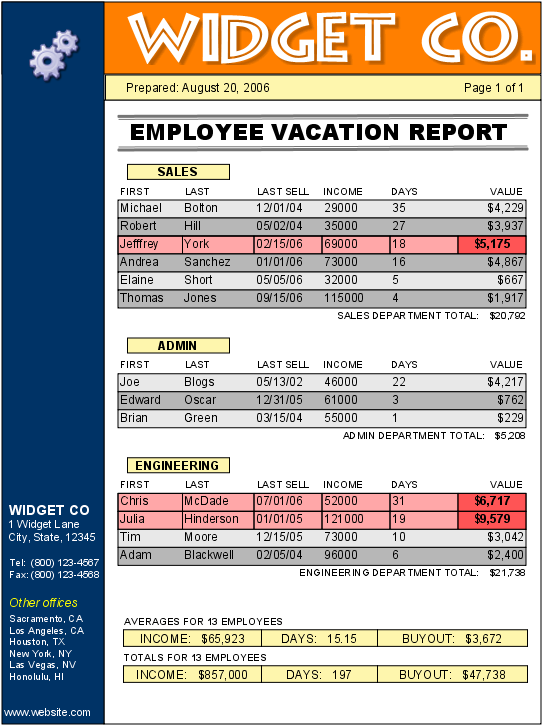
We're going to make a few minor aesthetic changes to give us room for graphs in the report. We will use both bar and pie graphs to indicate how many vacation days and how much vacation buyout money employees are entitled to. These graphs provide managers with an accurate idea on where they stand at a quick glance.
Almost everything here has been covered in Tutorial #1.
SELECT *, CAST(income/360 * 1.5 * vacationdays AS SIGNED) buyout FROM employees WHERE (income/360 * 1.5 * vacationdays) > 5000; We are creating a second DataSet that contains the subset of employees whose buyout value exceeds $5000. This will simplify our conditional average and total calculations.
|