|
After going through the documentation, you've come up with the following strategy:
| 2. | Pie graphs should be simple enough. They need to be grouped by department. We will embed them within our department grouping. |
| 3. | Bar graphs will be exactly like pie graphs. |
| 4. | The summary bar chart needs to be outside department grouping. You choose to put it in the table summary. |
| 5. | Averages and totals should be no problem with aggregate keys. These will be placed with the above graph. |
| 6. | The last requirement strikes you as tricky to calculate within the report. You realize that you're dealing with a subset of the employees based on a definable condition, but maintaining totals and averages over that subset looks ugly. Can it be done with assignment expressions? Yes, but why not leverage our SQL database? |
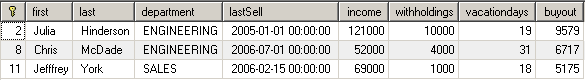
You can come up with a single simple query that will return all employees with a buyout value > $5000. The report will see two different DataSets and can easily perform aggregate functions (total, min/max, average) on either. An additional benefit is that if you need to change the requirements you need only change one query.
SELECT *, CAST(income/360 * 1.5 * vacationdays AS SIGNED) buyout FROM employees WHERE (income/360 * 1.5 * vacationdays) > 5000 ;
Index Previous (Background) Next (Basic Layout)
TIP
|
Get in the habit of utilizing the SQL database. It is easier to manipulate the data before the report gets it. This is especially true when you need to do joins or have other complex query requirements.
|
|