|
The most interesting portion of this report will be a table. It will occupy as much space as the size that we drag it on the screen, creating extra pages as necessary for the data.
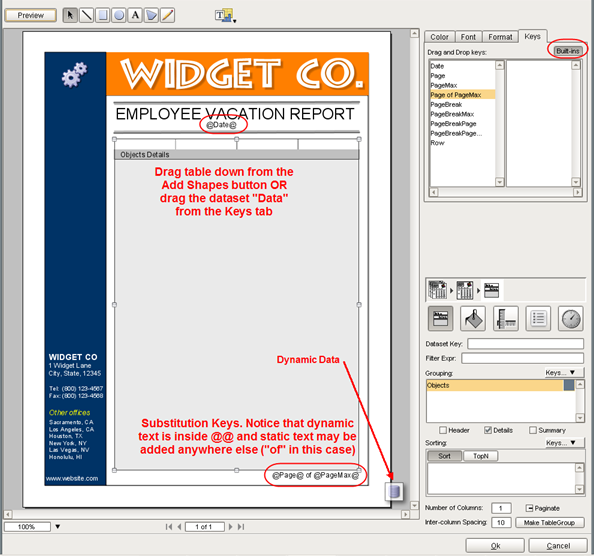
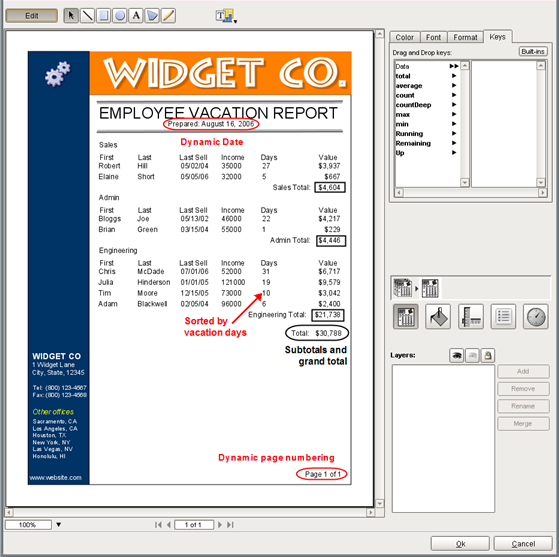
Adding Page Numbers
| 1. | Select the keys tab, click the Built-ins button, then drag the Date key into the report header. The cursor will change to the Drag Key icon  . Releasing the mouse button will place a label with the text "@Date@". . Releasing the mouse button will place a label with the text "@Date@". |
| 2. | Repeat, dragging the builtin key "Page @Page@ of @PageMax@" to the footer (bottom) of the report. |
| 3. | Format the date by double clicking the text label to superselect the text, then use the formatter to format the date. |
Creating Table
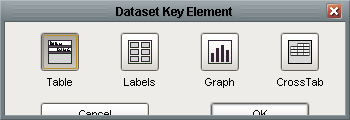
| 1. | Drag the DataSet Data from the keys tab and choose table when you see the Dataset Key Element window above. Select table and click ok. |
Alternatively, create the table from the toolbar then drag down the Data key to the Dataset key field of the keys attribute panel. Defining the table's DataSet is done automatically when using the step above.
| 2. | Resize and position the window as desired. |
Table Customization
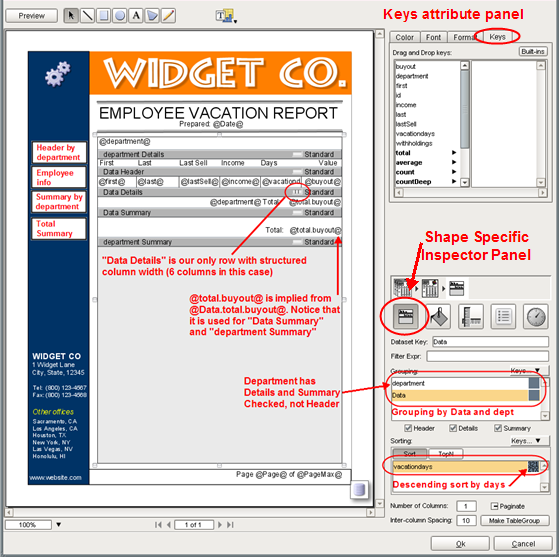
| 2. | Select Data under grouping and check: Header, Details, and Summary. This creates a unique header and summary row for each unique department. Data Details refers to each employee. |
| 3. | Select department under grouping and check: Details, and Summary. Summary creates a single summary row for the report. Details at this level of grouping is just above as the Data Header level of Data (We could have used either one instead of both for this example). More on table row grouping precedence here. |
| 4. | Modify the structured column width property for each row. This defines how many columns, of a fixed user definable width, a given table row will use. We will use 6 columns for Data Details, and not use structured columns for the others. Not using structured column width can be set by unchecking the top checkbox shown below or by de-selecting the row's prison icon  when the table is superselected. when the table is superselected. |
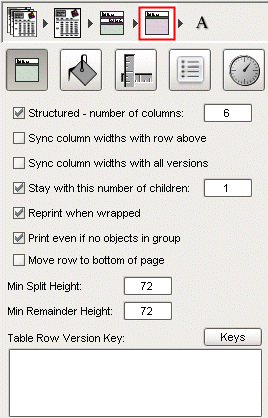
Superselect table, then single click select row to pull up this inspector
| 5. | Drag keys into table row columns. See the six columns in the Data Details row of the screenshot below. Notice the use of text editing, and text formatting. |
The total aggregate key, @total.buyout@, is used for both departmental subtotals and the grand total. The difference lies in the level of grouping it is placed in and is explained here.
Sorting and Grouping
| 1. | From the keys attribute panel, double click to drill down Data, then drag down department to the grouping field. This will automatically group our table by the department key. Each unique value of department will be represented by a separate table with the employees from that department. |
| 2. | From the keys attribute panel, drag down vacationdays to the sorting field then click the sort icon from ascending  to descending to descending  . This sorts our employees by vacation days from most to least. . This sorts our employees by vacation days from most to least. |
Preview
| 1. | Click the preview button  to view your report. to view your report. |
Index Previous Next (Row Versioning)
TIP
|
Don't be afraid to play with these options! It is much easier than it looks!
|
|