Description
The Pie Chart component displays a familiar-looking pie chart. A Pie Chart displays a list of named items, each of which has a value that is part of a total. The total is the sum of the value of each item. The key to the Pie Chart component is the Data property, which contains the items that will be displayed as pie wedges. Typically, this dataset will be bound to a SQL Query Binding to pull dynamic data out of an external database.
Extract Order
Similar to other charts, the pie chart can actually accept data in two formats. You can tell the pie chart which format to use via its Extract Order property. The two extract orders are By Column or By Row. The following table shows the two styles for the data that created the pie chart in the screenshot.
By Column |
By Row |
||||||||||||||||||
|
|
Labels
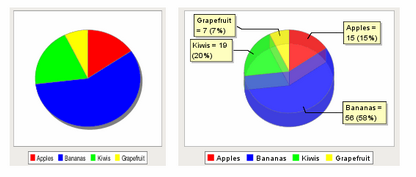
In addition to the color-coded legend, the pie chart can annotate each wedge with a label. The format of the label is controlled via the Label Format property. For example, the format string used in the screenshot is "{0} = {2} ({3})"
This is a pattern string that uses the following placeholders:
| • | {0} - the item label |
| • | {1} - the item value |
| • | {2} - the item percentage |
Properties
Appearance |
|||||||||||||||||||||||||||||||||||||
Chart Title |
An optional title that will appear at the top of the chart.
|
||||||||||||||||||||||||||||||||||||
Plot Background |
The background color for all plots, unless they override it
|
||||||||||||||||||||||||||||||||||||
Section Colors |
The colors to use for the pie wedge fills.
|
||||||||||||||||||||||||||||||||||||
Outline Colors |
The colors to use for the pie wedge outlines.
|
||||||||||||||||||||||||||||||||||||
Outline Stroke |
The width for the section outline stroke.
|
||||||||||||||||||||||||||||||||||||
Legend? |
Should there be an item legend below the chart?
|
||||||||||||||||||||||||||||||||||||
Labels? |
Should labels be displayed near sections?
|
||||||||||||||||||||||||||||||||||||
Label Format |
Formatting String. '{0}' is the wedge name, '{1}' is the value, '{2}' is the percent.
|
||||||||||||||||||||||||||||||||||||
Tooltip Format |
Formatting String. '{0}' is the wedge name, '{1}' is the value, '{2}' is the percent.
|
||||||||||||||||||||||||||||||||||||
Legend Font |
The font for legend items, if there is a legend.
|
||||||||||||||||||||||||||||||||||||
Label Font |
The font for labels items, if there are labels.
|
||||||||||||||||||||||||||||||||||||
Title Font |
The font for the chart's title.
|
||||||||||||||||||||||||||||||||||||
Antialias |
Draw with antialias on? Makes text smoother
|
||||||||||||||||||||||||||||||||||||
Starting Angle |
The start angle to draw the pie wedges.
|
||||||||||||||||||||||||||||||||||||
Rotation |
Draw the wedges clockwise or counter-clockwise from the starting angle?
|
||||||||||||||||||||||||||||||||||||
Enforce Circularity? |
If true, the pie cannot be an oval, even if the overall chart is.
|
||||||||||||||||||||||||||||||||||||
Style |
Style of pie chart, standard, 3D, or ring.
|
||||||||||||||||||||||||||||||||||||
3D? |
Deprecated. Use Style property instead.
|
||||||||||||||||||||||||||||||||||||
Foreground Transparency |
The transparency of the pie (useful for 3D pies)
|
||||||||||||||||||||||||||||||||||||
3D Depth Factor |
The depth of a 3D pie as a factor of the chart height
|
||||||||||||||||||||||||||||||||||||
Selection Highlight Color |
The color of the selection highlight
|
||||||||||||||||||||||||||||||||||||
Selection Highlight Width |
The line width of the selection highlight
|
||||||||||||||||||||||||||||||||||||
Behavior |
|||||||||||||||||||||||||||||||||||||
Tooltips? |
Should tooltips be displayed when the mouse hovers over sections?
|
||||||||||||||||||||||||||||||||||||
Selection Enabled? |
If true, the user will be able to select wedges on the chart. The selected wedge will be highlighted, and the "selectedData" property will reflect it.
|
||||||||||||||||||||||||||||||||||||
Common |
|||||||||||||||||||||||||||||||||||||
Name |
The name of this component.
|
||||||||||||||||||||||||||||||||||||
Visible |
If disabled, the component will be hidden.
|
||||||||||||||||||||||||||||||||||||
Border |
The border surrounding this component. NOTE that the border is unaffected by rotation.
|
||||||||||||||||||||||||||||||||||||
Mouseover Text |
The text that is displayed in the tooltip which pops up on mouseover of this component.
|
||||||||||||||||||||||||||||||||||||
Cursor |
The mouse cursor to use when hovering over this component.
|
||||||||||||||||||||||||||||||||||||
Data |
|||||||||||||||||||||||||||||||||||||
Data |
The data driving the chart.
|
||||||||||||||||||||||||||||||||||||
Extract Order |
Controls whether or not a pie plot views columns as pies, or rows.
|
||||||||||||||||||||||||||||||||||||
Selected Wedge |
The currently selected wedge
|
||||||||||||||||||||||||||||||||||||
Data Quality |
The data quality code for any tag bindings on this component.
|
||||||||||||||||||||||||||||||||||||
Scripting
Events
The following event sets are fired by this component. See Component Event Handlers to learn more.
| • | mouse |
| • | mouseMotion |
| • | propertyChange |
Scripting Functions
This component has no special scripting functions.