Description
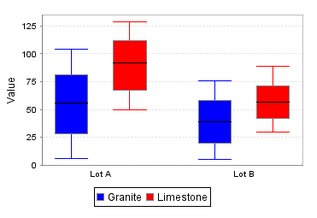
A Box and Whisker chart displays pertinent statistical information about sets of data. Each box represents a set of numbers. The upper and lower bounds of the box represent the 1st and 3rd quartiles. The line inside the box represents the median. The extends of the "whiskers" represent the max and min outliers. For a more detailed description, see http://mathworld.wolfram.com/Box-and-WhiskerPlot.html.
The configuration for setting up a box and whisker chart, like most charts, is populating the Data property. The dataset for a box and whisker chart contains sets of numbers. Each column defines a series of values, for which a "box" will be calculated. The column headers define the name for the box. You may also have an optional first column that is a String column, which can break up the series into categories. For example, the data that generated the plot in the screenshot would have looked like this:
Key (String) |
Granite (Integer) |
Limestone (Integer) |
Lot A |
23 |
39 |
Lot A |
24 |
23 |
Lot A |
93 |
54 |
Lot A |
76 |
72 |
Lot B |
21 |
83 |
Lot B |
4 |
21 |
Lot B |
76 |
98 |
Lot B |
89 |
102 |
Properties
Appearance |
|||||||||||||||||||||||||||||||||||||
Font |
Font of text of this component
|
||||||||||||||||||||||||||||||||||||
Chart Title |
An optional title that will appear at the top of the chart.
|
||||||||||||||||||||||||||||||||||||
Value Axis Title |
A text label to display on the value axis.
|
||||||||||||||||||||||||||||||||||||
Category Axis Title |
A text label to display on the category axis.
|
||||||||||||||||||||||||||||||||||||
Series Colors |
The colors to paint each box in a series.
|
||||||||||||||||||||||||||||||||||||
Plot Background |
The background color for the plot.
|
||||||||||||||||||||||||||||||||||||
Fill Boxes? |
Fill the boxes with their color?
|
||||||||||||||||||||||||||||||||||||
Legend? |
Show a legend on the chart?
|
||||||||||||||||||||||||||||||||||||
Antialias |
Draw with antialias on? Makes text smoother
|
||||||||||||||||||||||||||||||||||||
Behavior |
|||||||||||||||||||||||||||||||||||||
Tooltips? |
Show tooltips on tasks?
|
||||||||||||||||||||||||||||||||||||
Common |
|||||||||||||||||||||||||||||||||||||
Name |
The name of this component.
|
||||||||||||||||||||||||||||||||||||
Visible |
If disabled, the component will be hidden.
|
||||||||||||||||||||||||||||||||||||
Border |
The border surrounding this component. NOTE that the border is unaffected by rotation.
|
||||||||||||||||||||||||||||||||||||
Mouseover Text |
The text that is displayed in the tooltip which pops up on mouseover of this component.
|
||||||||||||||||||||||||||||||||||||
Cursor |
The mouse cursor to use when hovering over this component.
|
||||||||||||||||||||||||||||||||||||
Data |
|||||||||||||||||||||||||||||||||||||
Data |
The data driving the chart.
|
||||||||||||||||||||||||||||||||||||
Data Quality |
The data quality code for any tag bindings on this component.
|
||||||||||||||||||||||||||||||||||||
Scripting
Events
The following event sets are fired by this component. See Component Event Handlers to learn more.
| • | mouse |
| • | mouseMotion |
| • | propertyChange |
Scripting Functions
This component has no special scripting functions.