Types of Charts
Each chart can be configured to use one of the following Execution Modes:
| • | Callable: This chart may be started via scripting or another chart's enclosing step on-demand. Any number of instances of this chart may be simultaneously running. |
| • | RunAlways: This chart will be started by the Gateway upon startup. It may not be executed in any other way. It is probable that this chart will be designed to never end, the idea being that there will always be exactly one instance of this chart running. |
| • | Disabled: This chart is not available for execution. |
Chart Lifecycle
The following diagram defines the states that the chart can be in, and when it flows from one to another:
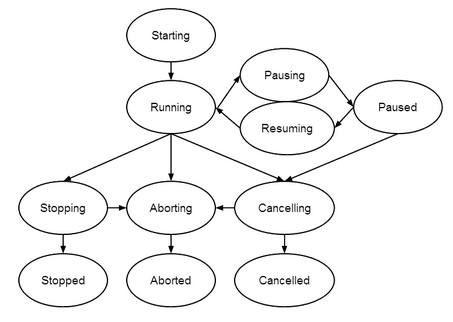
The chart has three terminal states: stopped, aborted, and canceled, and each has a different meaning:
| • | Stopped: This means the chart stopped normally by reaching an End Step. |
| • | Aborted: This means the chart stopped abnormally because of an error. |
| • | Canceled: This means that the chart was canceled by a user or a call to system.sfc.cancelChart() |
The chart can have scripts configured to run during some transitions between states.
| • | onStart: This script will run before the chart moves to the Running state |
| • | onStop: This script runs in the Stopping state before the chart moves to Stopped state. |
| • | onAbort: This script runs in the Aborting state before the chart moves to Aborted state. If this script creates an error, it will be logged, and then the chart will move to Aborted state. |
| • | onCancel: This script runs in the Canceling state before the chart moves to Canceled state. |
Chart Instances
Each chart you define in the Designer may be invoked multiple times, and each invocation will start a new instance of that chart. The instances may be started with different starting parameters which affect how the chart works. Each instance runs completely independently of the other instances. The ability to have multiple instances of a chart is one important feature that makes SFCs within Ignition different than SFCs inside of PLCs.
Chart Scope
The term “scope” means a collection of named variables that are accessible to the elements of a chart. Each chart instance gets its own, private scope. Scopes are basically free-form name-value maps, whose values may be any python object, including scalar and multivariate types.
Each chart gets a scope object that can be accessed from all steps and transitions within that chart. When starting a chart (for example, from a script), you’ll be able pass variables to the chart: those variables will appear in the chart’s scope. The variables that a chart expects to receive, and their default values, may be defined by configuring the Begin Step.