This section explains how chart execution works.
Proper Structure
Before a chart may be executed, it must have correct structure. When designing a chart, the designer will constantly let you know whether or not your chart is valid or not. If your chart is not valid, you may choose to show the errors, which will show up as red triangles in the corner of any element which has a problem. Hover your mouse over these elements to discover what is wrong with them.
Here are some rules about structure to keep in mind:
| • | Everything must be fully connected (except for notes). |
| • | Flow typically moves from top to bottom. All elements must be entered from the top and exit from the bottom (not the sides). |
| • | There may be any number of end steps. If flow reaches an end step, the chart is stopped. If there are no end steps, it means that your chart must loop back upon itself to satisfy the connected rule. |
| • | End steps are not allowed inside parallel sections. |
Getting Started
A chart may be started in one of four ways:
| 1. | From Scripting: Using the system.sfc.startChart method of the scripting API, a chart may be started from anywhere. The chart must be in "Callable" execution mode. |
| 2. | From an Enclosing Step: A chart may spawn an instance of another chart using an enclosing step. |
| 3. | Automatically: A chart whose execution mode is "RunAlways" will be automatically started when the gateway starts up. If the chart stops, the gateway will not re-execute it. If you want a chart that runs all the time, it should be designed to never stop (for example, by looping back upon itself continuously.) |
| 4. | From the Designer: While designing a chart, you may start instances of it from the "Chart Control" panel in the designer using the "Start" link. |
Chart Flow
All charts start at their begin step. The begin step can define initial values for variables in the chart's scope. These initial values are defined as expressions.
Flow always moves downward out of chart elements, except for links, which can move flow in any direction.
When flow hits a step, that step is started. The step continues to execute until the transition beneath it becomes true. If there is no transition beneath a step, the step starts and is told to stop as soon as possible. In practice, this means that an action step's onStart and onStop scripts will be run, but no timer scripts.
Examples:
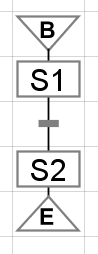
|
In this example, step S1 executes as soon as the chart starts, and continues executing until the transition beneath it becomes true. Once that transition becomes true, Step S1 is told to stop, which means it will finish executing any scripts that are currently running, and then it will execute its onStop action (if any).
After S1 has stopped, step S2 starts. It is immediately told to stop, which means that if it has any timer actions, they will not run, but the start and stop actions will run.
After S2 is finished, the chart stops. |
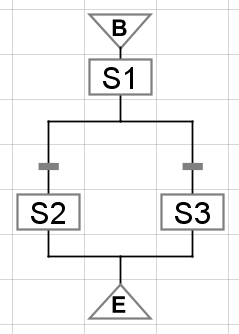
|
In this example, step S1 executes as above, except that it has two transitions beneath it. This is how you do conditional logic in a chart. S1 will run until either of these transitions becomes true. When one transition becomes true, flow will follow that branch of of the chart. If both transitions are true, the transition on the left is chosen. Position is meaningful for charts - transition precedence goes from left to right.
Only one of S2 or S3 will run, but never both. |
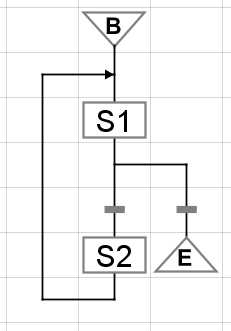
|
In this example, S1 executes as above, but may execute multiple times. This is how you configure repeating logic in a chart. The two transitions will determine whether this chart continues running (possibly indefinitely) or stops. |
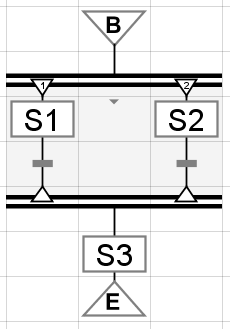
|
In this example, steps S1 and S2 execute simultaneously. They both will continue to run until the transitions beneath them become true.
Flow only moves past the parallel sync (the bottom of the parallel section) once both transitions become true. Step S3 will then run, and then the chart stops. |