Introduction
A Sequential Function Chart, or SFC, uses a graphical programming language based upon the IEC 61131-1 standard. This language may be familiar to PLC programmers, as it is one of the languages commonly available for programming PLCs.
SFCs are used to execute logic in ways that are more convenient to structure than with Python scripts alone. Because of their inherently visual depiction, they help to illuminate logic to users, and facilitate intuitive development and refinement. Charts can be monitored as they run visually, making troubleshooting easier than with scripting alone.
Furthermore, some things are hard to program using basic Python scripts, for example: running tasks in parallel, writing long-running or slow tasks, and structuring tasks that must wait for conditions before proceeding. These types of things are easy to program using SFCs.
Architecture
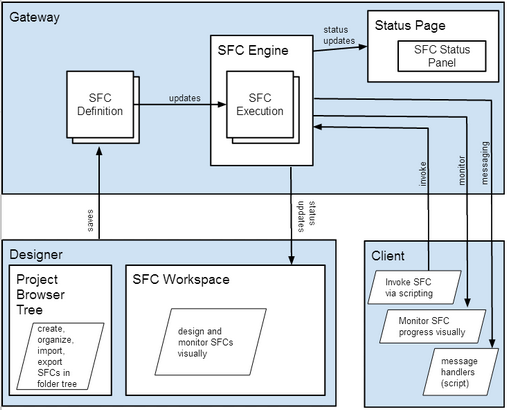
This section discusses how SFCs fit into and work with the rest of Ignition.
SFCs are designed through drag-and-drop manipulation in the Designer. The charts can be found under the "Global" folder in the Designer's project browser. Charts are not part of any specific project; they are shared by all projects.
SFCs are executed in the Gateway. While any scope (client, designer, or gateway) may start a new chart instance, the chart instance always executes in the Gateway.
SFC instances may be monitored in either the Client or the Designer. To monitor a running chart instance in the Designer, one can open that chart in the SFC workspace and double-click on the running instance. To monitor a running chart in the Client, a Vision project must be designed that uses the SFC module's monitoring panel component.