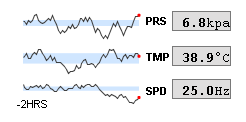
Three sparklines used to augment a numeric readout
Description
The sparkline chart is a minimalistic chart component that displays a line-chart history for a single datapoint. Sparklines were invented by Edward Tufte as a way to show a great deal of contextual information in a very small amount of space. Sparklines are typically used to display the recent history (up to current time) of a datapoint so that the viewer can quickly discern the recent trend of a datapoint: is it rising? falling? oscillating? etc..
To use a sparkline, bind its Data property either to a SQLTag Historian realtime query, or to a database query. There should be two columns in this dataset: the first one a date column, the second a number. Each row will become a datapoint on the chart, and the dataset must be sorted by time in ascending order.
Instead of using axes to convey scale, the sparkline can display a band of color across the back of the chart which indicates the desired operating range of the datapoint. In this way, it is instantly obvious when a value is in its expected range, above that range, or below. The sparkline automatically configures its internal axes based on the data given to it. To give it a fixed range, simply fill in the Range High and Range Low properties.
Properties
Appearance |
|||||||||||||||||||||||||||||||||||
Background Color |
The background color of the component.
|
||||||||||||||||||||||||||||||||||
Line Color |
The color of the sparkline.
|
||||||||||||||||||||||||||||||||||
Line Width |
The width of the sparkline.
|
||||||||||||||||||||||||||||||||||
Desired Range Color |
The color of the desired operating range band. Only used if the desired operating range is configured.
|
||||||||||||||||||||||||||||||||||
Border Inset |
The amount of space to inset the chart inside its border.
|
||||||||||||||||||||||||||||||||||
Styles |
Contains the component's styles
|
||||||||||||||||||||||||||||||||||
Common |
|||||||||||||||||||||||||||||||||||
Name |
The name of this component.
|
||||||||||||||||||||||||||||||||||
Visible |
If disabled, the component will be hidden.
|
||||||||||||||||||||||||||||||||||
Border |
The border surrounding this component. NOTE that the border is unaffected by rotation.
|
||||||||||||||||||||||||||||||||||
Mouseover Text |
The text that is displayed in the tooltip which pops up on mouseover of this component.
|
||||||||||||||||||||||||||||||||||
Cursor |
The mouse cursor to use when hovering over this component.
|
||||||||||||||||||||||||||||||||||
Data |
|||||||||||||||||||||||||||||||||||
Data |
The history data to draw in the sparkline chart.
|
||||||||||||||||||||||||||||||||||
Range High |
A fixed value for the upper edge of the chart. If left blank (null), the upper range will be calculated automatically.
|
||||||||||||||||||||||||||||||||||
Range Low |
A fixed value for the lower edge of the chart. If left blank (null), the lower range will be calculated automatically.
|
||||||||||||||||||||||||||||||||||
Desired High |
The high value of the desired operating range. If left blank (null), no desired range band will be shown.
|
||||||||||||||||||||||||||||||||||
Desired Low |
The low value of the desired operating range. If left blank (null), no desired range band will be shown.
|
||||||||||||||||||||||||||||||||||
First Value |
The first (oldest) value in the dataset
|
||||||||||||||||||||||||||||||||||
Last Value |
The last (most recent) value in the dataset.
|
||||||||||||||||||||||||||||||||||
Min Value |
The smallest value in the dataset.
|
||||||||||||||||||||||||||||||||||
Max Value |
The largest value in the dataset.
|
||||||||||||||||||||||||||||||||||
Chart Max |
The value that corresponds to the upper edge of the chart.
|
||||||||||||||||||||||||||||||||||
Chart Min |
The value that corresponds to the lower edge of the chart.
|
||||||||||||||||||||||||||||||||||
Data Quality |
The data quality code for any tag bindings on this component.
|
||||||||||||||||||||||||||||||||||
Markers |
|||||||||||||||||||||||||||||||||||
First Marker Color |
The color of the first value marker
|
||||||||||||||||||||||||||||||||||
First Marker Style |
The style of the first value marker
|
||||||||||||||||||||||||||||||||||
First Marker Size |
The size of the first value marker
|
||||||||||||||||||||||||||||||||||
Last Marker Color |
The color of the last value marker
|
||||||||||||||||||||||||||||||||||
Last Marker Style |
The style of the last value marker
|
||||||||||||||||||||||||||||||||||
Last Marker Size |
The size of the last value marker
|
||||||||||||||||||||||||||||||||||
Low Marker Color |
The color of the low value marker
|
||||||||||||||||||||||||||||||||||
Low Marker Style |
The style of the low value marker
|
||||||||||||||||||||||||||||||||||
Low Marker Size |
The size of the low value marker
|
||||||||||||||||||||||||||||||||||
High Marker Color |
The color of the high value marker
|
||||||||||||||||||||||||||||||||||
High Marker Style |
The style of the high value marker
|
||||||||||||||||||||||||||||||||||
High Marker Size |
The size of the high value marker
|
||||||||||||||||||||||||||||||||||
Scripting
Events
The following event sets are fired by this component. See Component Event Handlers to learn more.
| • | mouse |
| • | mouseMotion |
| • | propertyChange |
Scripting Functions
This component has no special scripting functions.