Description
This component is used to make powerful and runtime-configurable timeseries charts. It is configured by defining a set of pens and axes. Each pen represents a series of data. Pens can be many different styles, such as line, area, bar, and shape. This chart automatically creates controls for picking the time range and for hiding or displaying pens.
Features
| • | Easy configuration |
| • | User-selectable set of pens |
| • | Automatic time-selection controls |
| • | SQL Query and/or SQLTags Historian data sources |
| • | Automatic SPC and calculated pen support |
| • | Zoom, Pan, X-Trace modes |
| • | Any number of Y-axes and subplots |
| • | Realtime or Historical |
Pens
The are three kinds of pens in the Easy Chart:
| 1. | SQLTags Historian Pens. These pens pull their data from the SQLTags Historian system. |
| 2. | Database Pens. These pens will automatically create SQL SELECT queries to pull data from a database table. Typically, this is a table that is the target of a Historical Transaction Group. |
| 3. | Calculated Pens. These pens display a calculated dataset based off another pen, such as a moving average or an SPC function such as the UCL (Upper Control Limit). |
Modes: Realtime vs Historical
The Easy Chart can operate in 3 different modes. These modes affect the range of data that is displayed, the controls the user is shown, and whether or not the chart polls for data.
| 1. | Historical Mode. In this mode, the user is shown a Date Range component to pick the range of data to fetch and display. The initial values of this component are set through properties on the chart. In historical mode, the chart does not poll. |
| 2. | Realtime Mode. In this mode, the user is given the opportunity to pick the amount of time in the past to display. For example, the last 5 minutes or the last 2 hours. The chart will poll at a rate according to the Poll Rate parameter. |
| 3. | Manual Mode. In this mode, the chart will use the values if its Start Date and End Date parameters to govern what data is displayed. Polling is controlled by having the Poll Rate at zero (polling off) or greater than zero. |
Basic Chart Configuration
The Easy Chart has many properties, like other components, that control its behavior. Things like its Mode, Polling Rate, etc are configured via the properties. All of the setup for adding pens, axes, subplots, etc is its Customizer. You can also drag and drop Historian-enabled SQLTags onto the chart directly in the Designer to add those tags as chart pens.
Y-Axes
The easy chart supports any number of Y-axes. To add an axis, go to the Axes tab of the chart customizer. When adding an axis, you get a number of options such as the type (numeric or logarithmic), label, color, autorange vs fixed range, and auto-ticks vs fixed ticks. You can also modify the position of the axis, but note that by default the Chart's Auto Axis Positioning property is enabled, which means that the chart will balance the axes automatically between left and right depending on demand. As pens are turned on and off by the user, only the axes that are used by visible pens are shown.
After you add your axes, you edit any pens that you want to use your new axes. Simply choose the new axis in the axis dropdown of the pen editing window.
Subplots
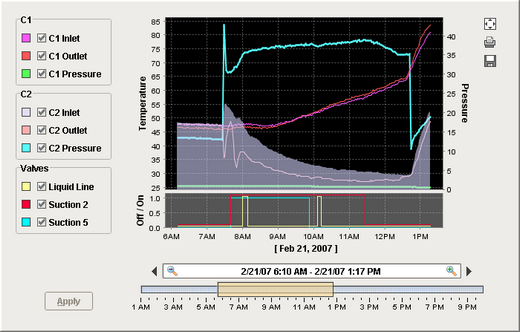
The Subplots feature lets you break up the chart's plot area into multiple distinct subplots that share the X axis, but have their own Y axes. This is often useful for digital data, as shown in the screenshot above. By default the chart has 1 subplot (the main plot). To add a new subplot, simply hit the add button in the Subplots tab of the chart customizer.
Subplots have relatively few options. The Weight option determines how much room the subplot gets relative to the other subplots. For example, in the screenshot above subplot #1's weight is 5, and subplot #2's weight is 1, leading to a 5-to-1 distribution of space. Just like axes, once you add your subplots you should go back to your pens and modify you pens' subplot property for any pens you want to appear on the subplot.
Pen Groups
You can put your pens in groups to break up the pens into some logical separation. For instance, in the screenshot above there are three pen groups: C1, C2, and Valves. The group name is used as the titled border for the pens' grouping container. Groups also have another purpose, but it is more advanced and most people won't have to worry about it. For more, read the Dynamic Pens section below.
Advanced Configuration
Dynamic Pens
In is often the case that you'll want to make one chart window that services many similar pieces of equipment. For instance, if you have 30 tanks and they all have the same datapoints, you want to be able to use one window for all 30 of them and simply pass the tank number into the chart window as a parameter. There are actually a number of ways to accomplish this, each method suitable for different scenarios.
Database pens have 2 ways to be made dynamic. The first is the Chart's Where Clause property. This is a snippet of SQL where clause syntax, like "machine_num = 28" that will be included for all database pens in their queries. The second is to use a dynamic group. Any group can be made a dynamic group in the customizer. For each dynamic group, the easy chart will get a special dynamic property associated with that group. That property is another snippet of SQL where clause that will be applied to all database pens in that group.
The other way to make your pens (and anything else about the chart) dynamic at runtime is to use dynamic configuration. Read on...
Dynamic Configuration
The Easy Chart is not just meant to be easy to configure, but also very powerful. In particular, there is an emphasis on the ability to make any configuration change dynamically in a client - not just statically in the Designer. While a bit of scripting or clever property binding may be required, the technique is very powerful. This is achieved by storing all of the settings that you alter in the customizer in a set of expert-level dataset properties. So altering the datasets alters the chart configuration. You can inspect these various datasets, which hold the pens, axes, and subplot information, to see their format. They all look up information by column name (case-insensitive). So, if you have pen configuration stored in a database, you can bind an indirect SQL Query binding to alter the chart's pen set at runtime.
Properties
Appearance |
|||||||||||||||||||||||||||||||||||||
Foreground Color |
The foreground color of the component.
|
||||||||||||||||||||||||||||||||||||
Background Color |
The background color of the component.
|
||||||||||||||||||||||||||||||||||||
Plot Background |
The background color for all plots, unless they override it
|
||||||||||||||||||||||||||||||||||||
Plot Outline |
The color to use for the plot outline.
|
||||||||||||||||||||||||||||||||||||
Date Editor Foreground |
The foreground color for the date editor.
|
||||||||||||||||||||||||||||||||||||
Date Editor Background |
The background color for the date editor.
|
||||||||||||||||||||||||||||||||||||
Gridline Color |
The color of the gridlines.
|
||||||||||||||||||||||||||||||||||||
Gridline Width |
The width (thickness) of the gridlines.
|
||||||||||||||||||||||||||||||||||||
Gridline Dash Pattern |
The dash pattern for the gridlines.
|
||||||||||||||||||||||||||||||||||||
Border |
The border surrounding the entire chart component.
|
||||||||||||||||||||||||||||||||||||
Chart Border |
The border for the chart itself
|
||||||||||||||||||||||||||||||||||||
Pen Control Border |
The border for the pen control panel, if visible
|
||||||||||||||||||||||||||||||||||||
Date Range Border |
The border for the date range control, if visible
|
||||||||||||||||||||||||||||||||||||
Chart Title |
Sets an optional title to be displayed above the chart
|
||||||||||||||||||||||||||||||||||||
Title Font |
The font for the optional chart title.
|
||||||||||||||||||||||||||||||||||||
X Axis Label |
The label shown on the X Axis (time axis)
|
||||||||||||||||||||||||||||||||||||
X Axis Visible |
Should the x-axis be displayed?
|
||||||||||||||||||||||||||||||||||||
Font |
Font of text of this component
|
||||||||||||||||||||||||||||||||||||
Axis Font |
The font for axis labels
|
||||||||||||||||||||||||||||||||||||
Tick Font |
The font for tick labels
|
||||||||||||||||||||||||||||||||||||
X-Trace Large Number Format |
The large decimal format for the x-trace value in the easy chart.
|
||||||||||||||||||||||||||||||||||||
X-Trace Small Number Format |
The small decimal format for the x-trace value in the easy chart.
|
||||||||||||||||||||||||||||||||||||
X-Trace Number Format Threshold |
If the magnitude of the to-be-formatted value is below this threshold, then the X-Trace Small Number Format will be used.
|
||||||||||||||||||||||||||||||||||||
Antialias |
Draw with antialias on? Makes text smoother
|
||||||||||||||||||||||||||||||||||||
Behavior |
|||||||||||||||||||||||||||||||||||||
Chart Mode |
Affects the mode that the chart operates in.Manual Mode: the data selected is determined by the values of the Start Date and End Date properties, which must be set manually.Historical Mode: a date range component will be displayed by the chart, allowing the user to select the time period they are interested inRealtime Mode: the user will be given the change to choose a span of time, like 15 minutes, and that span will be updated at the poll rate as the data scrolls across
|
||||||||||||||||||||||||||||||||||||
Pen Control? |
Controls whether or not end-users can turn on and off pens.
|
||||||||||||||||||||||||||||||||||||
Pen Control Mode |
The style in which the pen control panel alters the chart configuration. In heavyweight mode, unchecked pens are not queried, but checking and unchecking pens refreshes the chart. In lightweight mode, all pens are queried, but checking and unchecking pens is quick.
|
||||||||||||||||||||||||||||||||||||
Auto Apply |
If true, user changes to pen visibility will occur immediately.
|
||||||||||||||||||||||||||||||||||||
Poll Rate |
The rate (in milliseconds) at which this chart's queries poll. Historical charts don't use this property.
|
||||||||||||||||||||||||||||||||||||
X Axis AutoRange? |
If true, the X axis will automatically fit the range of available data, if false, it will display a fixed range based on the start date and end date.
|
||||||||||||||||||||||||||||||||||||
X Axis Margin |
A margin for the upper and lower ends of the x axis, expressed as a percentage of the total range.
|
||||||||||||||||||||||||||||||||||||
Empty Group Name |
The group name to use for pens that are not in a pen group.
|
||||||||||||||||||||||||||||||||||||
Group Pens |
If true, pens will be grouped by their group name
|
||||||||||||||||||||||||||||||||||||
Auto Axis Positioning |
If true, axes alternate automatically between left and right, rather than being placed explicitly.
|
||||||||||||||||||||||||||||||||||||
Auto Pen Coloring |
If true, pens are assigned different colors automatically.
|
||||||||||||||||||||||||||||||||||||
Auto Color List |
The list of colors to use if auto pen coloring is enabled
|
||||||||||||||||||||||||||||||||||||
Allow Color Changes |
If true, pen colors can be set to different values.
|
||||||||||||||||||||||||||||||||||||
Show Loading |
If true, an animated indicator will be shown when data is loading
|
||||||||||||||||||||||||||||||||||||
Show Warnings |
If true, warnings generated during chart configuration will be printed to the console.
|
||||||||||||||||||||||||||||||||||||
Show Popup? |
If true, a popup menu will be shown on right-click that allows the user to change mode, print, save, etc.
|
||||||||||||||||||||||||||||||||||||
Show Tooltips? |
If true, tooltips showing point values will be displayed on the chart.
|
||||||||||||||||||||||||||||||||||||
Chart Configuration |
|||||||||||||||||||||||||||||||||||||
DB Pens |
This Dataset defines all of the database pens for the chart.
|
||||||||||||||||||||||||||||||||||||
Tag Pens |
This Dataset defines all of the Tag History pens for the chart.
|
||||||||||||||||||||||||||||||||||||
Calculated Pens |
This Dataset defines the calculated pens for the chart.
|
||||||||||||||||||||||||||||||||||||
Axes |
This Dataset defines all axes that can be used by the pens.
|
||||||||||||||||||||||||||||||||||||
Subplots |
This Dataset defines all subplots' relative size and color.
|
||||||||||||||||||||||||||||||||||||
Common |
|||||||||||||||||||||||||||||||||||||
Name |
The name of this component.
|
||||||||||||||||||||||||||||||||||||
Visible |
If disabled, the component will be hidden.
|
||||||||||||||||||||||||||||||||||||
Mouseover Text |
The text that is displayed in the tooltip which pops up on mouseover of this component.
|
||||||||||||||||||||||||||||||||||||
Cursor |
The mouse cursor to use when hovering over this component.
|
||||||||||||||||||||||||||||||||||||
Data |
|||||||||||||||||||||||||||||||||||||
Selected X Value |
The selected domain axis value for X-Trace and Mark modes.
|
||||||||||||||||||||||||||||||||||||
Where Clause |
A snippet of where clause that will be applied to all pens, like "TankNum = 2"
|
||||||||||||||||||||||||||||||||||||
Start Date |
For manual-mode. The start date to use for selecting pen data
|
||||||||||||||||||||||||||||||||||||
End Date |
For manual-mode. The end date to use for selecting pen data
|
||||||||||||||||||||||||||||||||||||
Historical Range |
|||||||||||||||||||||||||||||||||||||
Startup Range |
For historical-mode date range. If startup mode is Automatic, this will be the starting range of time available for selection.
|
||||||||||||||||||||||||||||||||||||
Startup Selection |
For historical-mode date range. If startup mode is Automatic, this will be the starting selected range.
|
||||||||||||||||||||||||||||||||||||
Max Selection |
For historical-mode date range. The maximum size of the selected date range.
|
||||||||||||||||||||||||||||||||||||
Outer Range Start |
For historical-mode date range. The start date for the outer range.
|
||||||||||||||||||||||||||||||||||||
Outer Range End |
For historical-mode date range. The end date for the outer range
|
||||||||||||||||||||||||||||||||||||
Date Style |
The style to display dates in. For international support.
|
||||||||||||||||||||||||||||||||||||
Time Style |
The style to display times of day. For international support.
|
||||||||||||||||||||||||||||||||||||
Show Density |
For historical-mode date range. If true, a data density histogram will be shown in the date range.
|
||||||||||||||||||||||||||||||||||||
Today Color |
For historical-mode date range. The color of the "Today Arrow" indicator
|
||||||||||||||||||||||||||||||||||||
Box Fill |
For historical-mode date range. The fill color for the selection box.
|
||||||||||||||||||||||||||||||||||||
Selection Highlight |
For historical-mode date range. The focus highlight color for the selection box
|
||||||||||||||||||||||||||||||||||||
Track Margin |
For historical-mode date range. The amount of room on either side of the slider track. May need adjusting of default font is changed.
|
||||||||||||||||||||||||||||||||||||
Tick Density |
For historical-mode date range. This is multiplied by the width to determine the current ideal tick unit.
|
||||||||||||||||||||||||||||||||||||
High Density Color |
For historical-mode date range. The color used to indicate high data density.
|
||||||||||||||||||||||||||||||||||||
Layout |
|||||||||||||||||||||||||||||||||||||
Plot Orientation |
The plot orientation for all plots.
|
||||||||||||||||||||||||||||||||||||
Maximize Plot |
If true, displays maximized plot.
|
||||||||||||||||||||||||||||||||||||
Invert Time Axis |
If true, the time axis values will increase from the right to left or from top to bottom depending on the Plot Orientation.
|
||||||||||||||||||||||||||||||||||||
Date Range |
Affects the position of the date range control.
|
||||||||||||||||||||||||||||||||||||
Legend |
Where the legend should appear, if any.
|
||||||||||||||||||||||||||||||||||||
Horiz Gap |
The horizontal spacing to use for the pen checkboxes
|
||||||||||||||||||||||||||||||||||||
Vert Gap |
The vertical spacing to use for the pen checkboxes
|
||||||||||||||||||||||||||||||||||||
Sort Pens |
If true, pens visibility checkboxes will be sorted.
|
||||||||||||||||||||||||||||||||||||
Subplot Gap |
The gap between subplots
|
||||||||||||||||||||||||||||||||||||
Pen Style Options |
|||||||||||||||||||||||||||||||||||||
Bar Margin |
The margin to use for the 'Bar' pen style
|
||||||||||||||||||||||||||||||||||||
Gap Threshold |
The relative threshold to use for determining continuity breaks for the 'Discontinous Line' pen style
|
||||||||||||||||||||||||||||||||||||
3D X Offset |
The offset to use in the x direction for the '3D Line' pen style
|
||||||||||||||||||||||||||||||||||||
3D Y Offset |
The offset to use in the y direction for the '3D Line' pen style
|
||||||||||||||||||||||||||||||||||||
Digital Gap |
The size of the gap to use between digital pens
|
||||||||||||||||||||||||||||||||||||
Realtime Range |
|||||||||||||||||||||||||||||||||||||
Unit Count |
For realtime-mode date range. The number of units back to display
|
||||||||||||||||||||||||||||||||||||
Unit |
For realtime-mode date range. The selected unit of the realtime date control
|
||||||||||||||||||||||||||||||||||||
Realtime Text |
For realtime-mode date range. The text to display on the realtime date control.
|
||||||||||||||||||||||||||||||||||||
Tag History |
|||||||||||||||||||||||||||||||||||||
Tag History Resolution |
The number of datapoints to request for tag history pens. -1 means raw data, 0 means automatic, which uses the width of the chart.
|
||||||||||||||||||||||||||||||||||||
Tag History Resolution Mode |
The mode to use for the number of requested points. Fixed will use the Tag History Resolution size, Natural will return a value per scan class execution, Automatic will be based on chart width, and Raw will be the raw data.
|
||||||||||||||||||||||||||||||||||||
Allow Tag History Interpolation |
If enabled, and the query mode is not raw, data will be interpolated for time spans with no data available.
|
||||||||||||||||||||||||||||||||||||
Validate Scan Class Executions |
Causes the tag history query to verify the scan class execution records, generating bad data for time periods where scan classes did not execute.
|
||||||||||||||||||||||||||||||||||||
Ignore Bad Quality Data |
If true, causes the system to ignore any bad quality data.
|
||||||||||||||||||||||||||||||||||||
Bypass Tag History Cache |
If true, tag history queries will not use the client tag history cache.
|
||||||||||||||||||||||||||||||||||||
Uncategorized |
|||||||||||||||||||||||||||||||||||||
Properties Loading |
The number of properties currently being loaded
|
||||||||||||||||||||||||||||||||||||
Total Datapoints |
The number of datapoints being displayed by the graph.
|
||||||||||||||||||||||||||||||||||||
Utility Buttons |
|||||||||||||||||||||||||||||||||||||
Show Maximize Button? |
If true, a small maximize button will be displayed next to the chart.
|
||||||||||||||||||||||||||||||||||||
Show Print Button? |
If true, a small print button will be displayed next to the chart.
|
||||||||||||||||||||||||||||||||||||
Show Save Button? |
If true, a small save button will be displayed next to the chart.
|
||||||||||||||||||||||||||||||||||||
Button Size |
The size of the utility button icons.
|
||||||||||||||||||||||||||||||||||||
Scripting
Events
The following event sets are fired by this component. See Component Event Handlers to learn more.
| • | mouse |
| • | mouseMotion |
| • | propertyChange |
Scripting Functions
|
||||||||
|
||||||||
Extension Functions
The easy chart has the following extension functions. See each function's doc string for usage details.
| • | configureChart() |
| • | getXTraceLabel() |
| • | onPowerTableRowsDropped() |
| • | onTagsDropped() |