Description
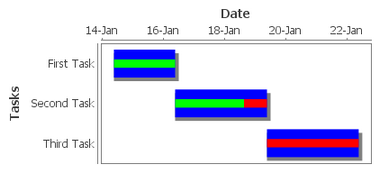
A Gantt chart is used for task scheduling. It shows a list of named tasks, each of which have a start date, an end date, and a percentage complete. This allows an easy way to visualize tasks, workflows, and scheduling.
The Gantt chart is configured by populating its Data property. Each row of the dataset represents a task. There should be four columns: the task label, the start date, the end date, and the percentage (0-100) complete.
Properties
Appearance |
|||||||||||||||||||||||||||||||||||||
Chart Title |
An optional title that will appear at the top of the chart.
|
||||||||||||||||||||||||||||||||||||
Task Axis Title |
|
||||||||||||||||||||||||||||||||||||
Date Axis Title |
|
||||||||||||||||||||||||||||||||||||
Task Color |
The main color to draw tasks
|
||||||||||||||||||||||||||||||||||||
Complete Color |
The color to draw the amount completed in.
|
||||||||||||||||||||||||||||||||||||
Incomplete Color |
The color to draw the amount remaining to do in.
|
||||||||||||||||||||||||||||||||||||
Plot Background |
The background color for the plot.
|
||||||||||||||||||||||||||||||||||||
Title Font |
The font for the optional chart title.
|
||||||||||||||||||||||||||||||||||||
Axis Font |
The font for axis labels
|
||||||||||||||||||||||||||||||||||||
Tick Font |
The font for tick labels
|
||||||||||||||||||||||||||||||||||||
Antialias |
Draw with antialias on? Makes text smoother
|
||||||||||||||||||||||||||||||||||||
Behavior |
|||||||||||||||||||||||||||||||||||||
Tooltips? |
Show tooltips on tasks?
|
||||||||||||||||||||||||||||||||||||
Common |
|||||||||||||||||||||||||||||||||||||
Name |
The name of this component.
|
||||||||||||||||||||||||||||||||||||
Visible |
If disabled, the component will be hidden.
|
||||||||||||||||||||||||||||||||||||
Border |
The border surrounding this component. NOTE that the border is unaffected by rotation.
|
||||||||||||||||||||||||||||||||||||
Mouseover Text |
The text that is displayed in the tooltip which pops up on mouseover of this component.
|
||||||||||||||||||||||||||||||||||||
Cursor |
The mouse cursor to use when hovering over this component.
|
||||||||||||||||||||||||||||||||||||
Data |
|||||||||||||||||||||||||||||||||||||
Data |
The data driving the chart.
|
||||||||||||||||||||||||||||||||||||
Data Quality |
The data quality code for any tag bindings on this component.
|
||||||||||||||||||||||||||||||||||||
Scripting
Events
The following event sets are fired by this component. See Component Event Handlers to learn more.
| • | mouse |
| • | mouseMotion |
| • | propertyChange |
Scripting Functions
This component has no special scripting functions.